Practical course 4:In Scaling Up Equipment Handling High-Viscosity Liquids, Missing "Changes in Flow behavior" Can Be Fatal!
Course 4In Scaling Up Equipment Handling High-Viscosity Liquids, Missing "Changes in Flow behavior" Can Be Fatal!
Scaling up mixing tanks is often considered challenging, especially for high-viscosity liquids. If changes in flow before and after scaling up are overlooked, there is a risk that the expected mixing performance cannot be reproduced in the actual equipment. This time, we will share important tips on scaling up helical ribbon impellers, which have long been used for high-viscosity applications. We hope you can visualize how "changes in flow" affect the power characteristics of the impellers and the flow mechanisms of the liquid.
Case Study: At a Sales Office of a Mixing Equipment Manufacturer
This is a sales office of a mixing equipment manufacturer. You can hear the sales office manager loudly talking on the phone with the company's technical department.
Mr. Ueda
Hey, we got a complaint from the customer about the quote we sent last week. They said, "The motor capacity is 1.6 times bigger than expected. What's going on?" Can you quickly set up a meeting with them to go over the specs? If we don't fix this, we might lose the deal during the technical negotiations. This is going to be a big problem!
Blendy
Ah, you're talking about the scale-up project with the high-viscosity ribbon impellers, right? We've received the lab and bench test data from the customer and have been reviewing the power requirements. There shouldn't be any issues...
No, no! The real issue here is our approach that's making the customer anxious about the specifications. You need to communicate with the customer and handle this carefully. I'm counting on you. If we lose this deal due to high costs from over-specification, the technical department will be held responsible! Understood?
After receiving Ueda Manager's usual motivational scolding, Blendy quickly called the customer's technical department.
Hello, regarding the quote from the other day... (mumbling)
Let's break down the main points the customer made during the phone call:
Customer's Arguments
Customer
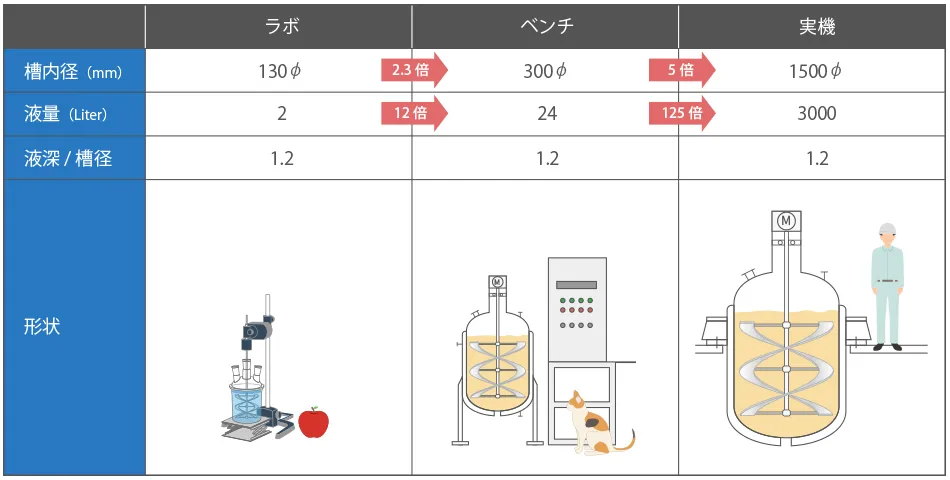
We have been developing the production recipe of a new product using in-house test machines (2 liters and 24 liters). This time, we intend to move to commercial-scale production using a 3 m3 full-scale machine. This will be a new capital investment project.
<Prerequisites for Consideration> 1) Liquid properties: Viscosity μ = 10,000 mPa·s, Density ρ = 1200 kg/m3 (almost Newtonian fluid) 2) The shape and dimensions of the tank and impeller : Almost geometrically similar. 3) Specified scale-up criteria: Maintain mixing performance, and ensure the rotational speed N remains the same at 50 rpm as in the test machine.
Figure 1. Changes in Equipment Size when Scaling Up
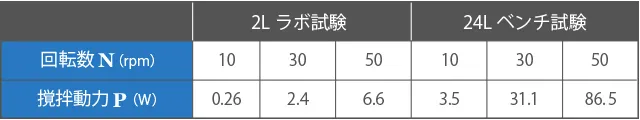
Table 1. Mixing Power Test Data at Customer Site
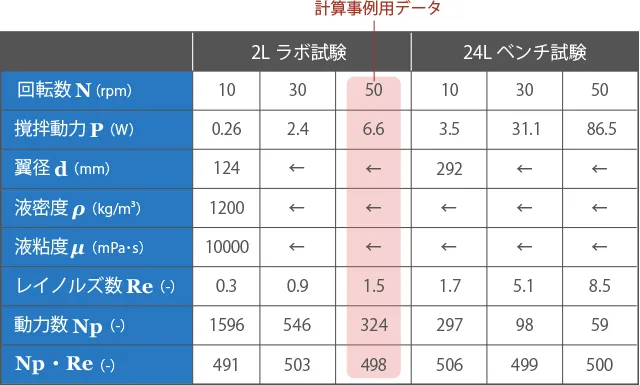
Table 2. Analysis and Evaluation of Customer Test Data
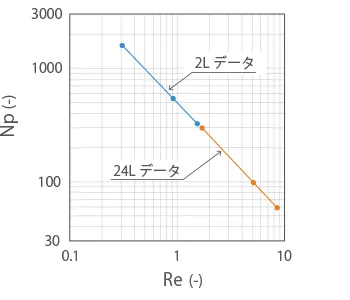
Figure 2. Power curve based on test data
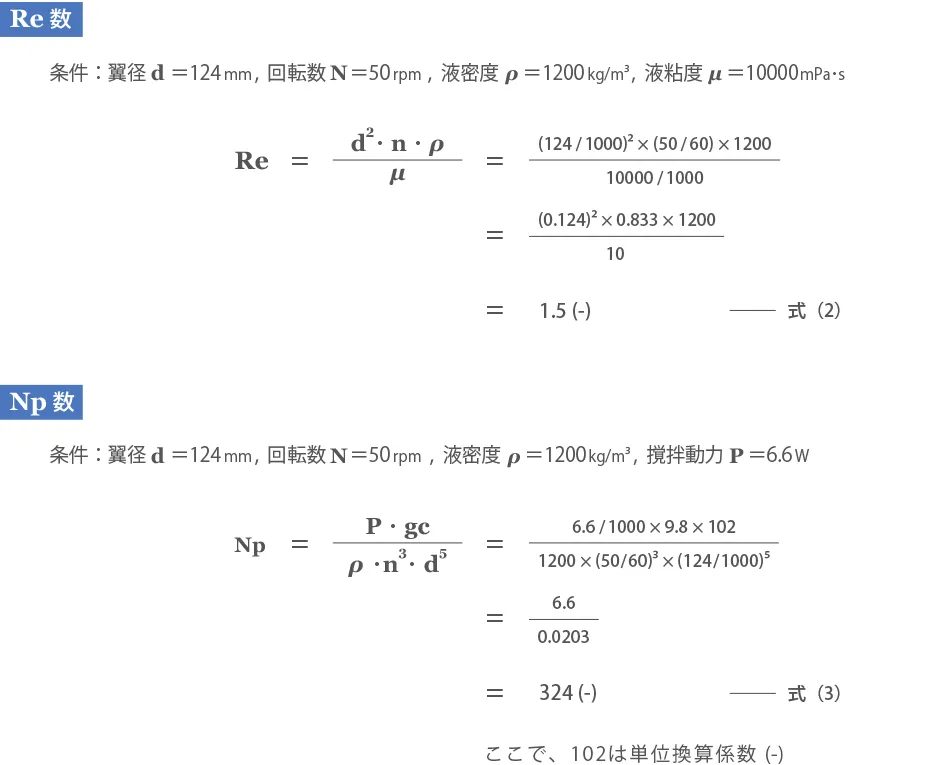
By plotting the Power number (Np) and Reynolds number (Re) from the power test data on a logarithmic graph, the following mixing power characteristics of the ribbon impeller can be obtained.
(Reference) The following are calculation examples.
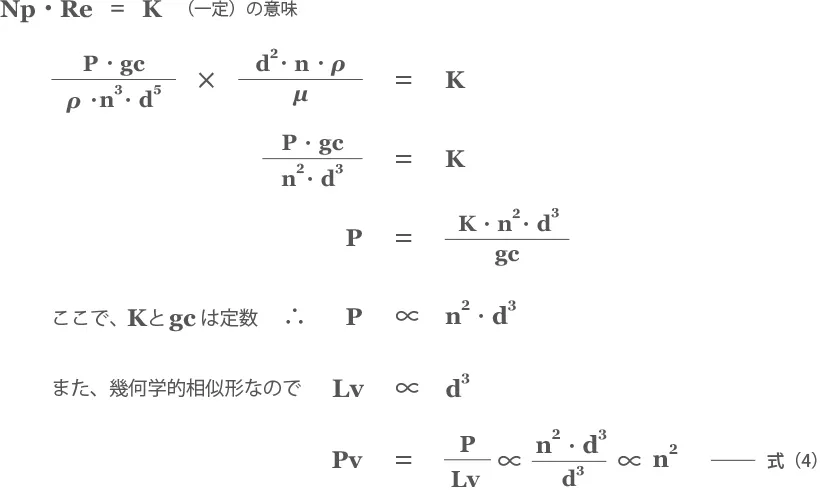
It has been shown in related literature that the power characteristics of ribbon impellers maintain a constant product of the Np value and the Re value. Furthermore, since this formula is dimensionless (indicators without units such as length, time, load, etc.), it should be applicable to scaled-up actual machines regardless of size, as long as the geometric similarity (ratio of dimensions such as tank and impeller) is maintained.
Additionally, in the scale-up of ribbon impellers, maintaining a constant rotational speed ensures consistent mixing performance. Therefore, we have planned the rotational speed of the actual machine to be the same as the test machine, at 50 rpm. In this case, the specific mixing power Pv (kW/m3) will remain the same before and after the scale-up, so the motor power capacity should be considered proportional to the liquid volume ratio.
From equation (4), the dimension of d, which represents size, is eliminated for the specific power Pv(kw/m3). Therefore, under the condition Np・Re=K(constant), to maintain the specific power after scaling up, the rotational speed should be kept the same.
We have previously conducted similar scale-up projects with higher viscosity products, so we are confident in our current assumptions. Additionally, an engineering company has provided a motor capacity estimate that matches our own.
The motor capacity selected by your company is 1.6 times larger. Isn't that too much of a margin?
Since the motor is larger, isn't the diameter of the agitator shaft also increased?
Could this be the reason why your price is higher than other companies?
That's the gist of the customer. The person on the phone seemed like an experienced mid-level engineer, and his explanation was very smooth. The more Blendy listened, the more he felt the fault might be ours. After the call, he worried about a mistake in his computer input, so he double-checked the input items in the company program, but found no errors. His imagination then ran wild, thinking there might be a problem with the power estimation program used internally, and he thought, "This is a big deal! I need to report this!" and headed to Dr. Nano's desk.
Nano-senpai! It looks like there's an issue with the in-house power calculation program. I'm thinking of asking the systems department to check it out ASAP.
Dr.Nano
Hmm? What's up? Can you tell me more specifically? What's the issue?
In the high viscosity range, the ribbon impeller's power should be Np·Re = K (constant). But the in-house program shows a power value 1.6 times higher. I've checked my input multiple times, and there are no mistakes.
So, what kind of "flow changes" are we seeing with this scale-up?
Huh, "flow changes"? Well, the fluid properties (viscosity and density) are exactly the same as during the scale-up, and we're working with pretty high-viscosity conditions. The impeller type is also just a standard ribbon shape.
Blendy seems confused, thinking it might be a design mistake from his department, and his responses are unclear. So, Dr. Nano rechecked just three points: "Operating liquid volume in lab, bench & commercial scale," "Liquid viscosity," and "Operating rotation speed." After a moment of silence, he smiled gently with kind eyes.
Don't worry, there's nothing wrong with our program. It's all good. Relax.
???
So, what exactly did Dr.Nano see or feel that made him decide everything was okay?
Point 1: Is it Laminar Flow, Turbulent Flow, or in the Transition Region?
When Dr. Nano asked about the "flow changes" before and after the scale-up, he wasn't referring to the viscosity of the process liquid or the shape of the impeller. He was asking whether it was "laminar flow," "turbulent flow," or in the "transition region." The main issue was that these three terms didn't come up during the earlier specification confirmation call with the customer engineer.
There's a saying, "can't see the forest for the trees," which means getting caught up in small details and missing the bigger picture. In this case, there is a lack of awareness of "flow regime changes" due to the rigid belief that a ribbon impeller is designed for high-viscosity liquids and that high viscosity always means laminar flow, which is only relevant for small-scale test machines.
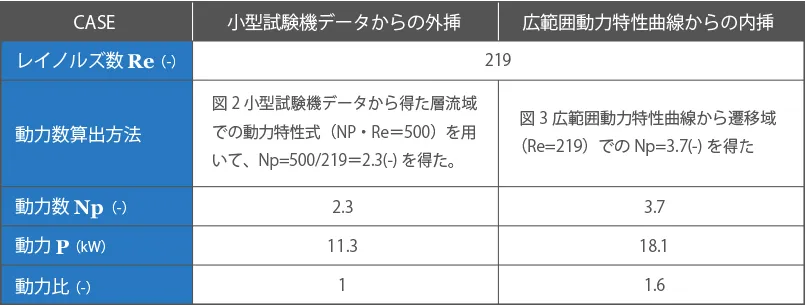
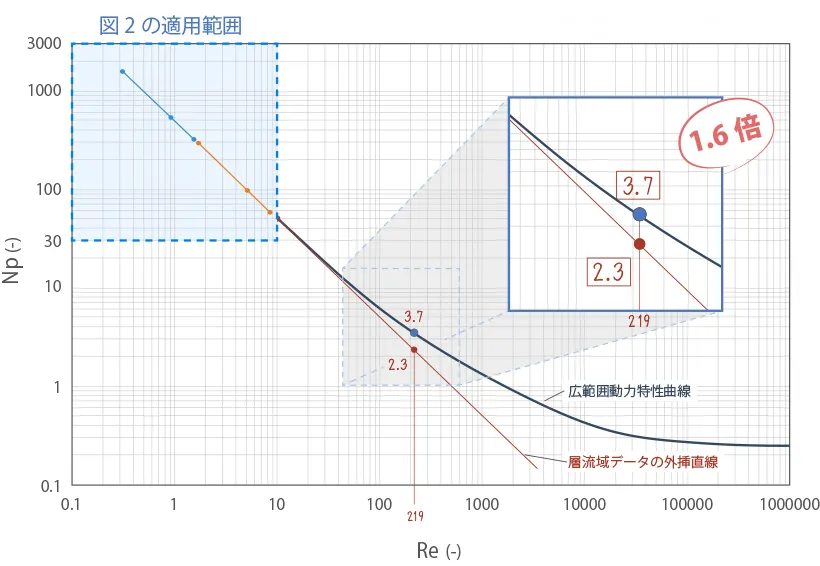
Table 3 shows the comparison of power calculation results for the actual 3m3 scale, and Figure 3 illustrates the wide range of power characteristics. From Figure 3, it's clear that the applicable Np value is 1.6 times different. In Dr. Nano's mind, just knowing the size before and after scale-up, the viscosity, and the rotation speed is enough to form a general image of the Reynolds number range at each scale. From this image, Dr. Nano instantly realized that the flow inside the mixing tank at the actual 3m3 scale had transitioned from the laminar region during the test to the transition region, making it outside the applicable range of the commonly used laminar region ribbon impeller power estimation formula. And then, he concluded that the customer's past successful scale-up under similar conditions was likely due to either the liquid viscosity being higher than this time or the actual equipment size not being significantly larger, which kept the flow regime within the laminar region even after scaling up, resulting in no changes in flow characteristics.
<Prerequisites for Consideration> Liquid Volume Lv=3,000 Liter, Tank inside diameter D=1,500 mm, Impeller diameter d=1,480 mm, Viscosity μ=10,000 mPa・s, Density ρ=1,200 kg/m3, Rotational speed N=50 rpm (specified by the customer)
Table 3. Power Estimation Comparison for Actual 3000 Liter Scale Tank
Figure 3. Power curve over a wide range of Reynolds numbers
Dr. Nano brought an old, dusty ring file from the archive and showed a specific page to Blendy. On that page, there was a handwritten Np-Re curve for the ribbon impeller. This was the power characteristic curve for the ribbon impeller that Dr. Nano had measured overnight when he was young. "Look here," he said, pointing to the area around Re numbers 50-100, where it was written,"Beware of flow regime changes in the transition region at actual scale!"
These days, you can easily get calculation results just by using a computer. But back then, designers created the mixing power estimation formulas from their own experimental data, with a sense of excitement and anticipation. You'll never forget the knowledge and experience you gain through your own hard work, and it's a valuable asset that no one can take from you. Power measurement tests are pretty easy to do, so you should try collecting and verifying the data yourself. There's still time before the order, so you can still make it!
Got it! I'll check it myself so I can confidently convince the customer!!
Blendy then conducted the power tests himself, created a "Test Report" and an "Opinion Document on Power Calculation for a 3m3 Actual Tank" based on the data, and held face-to-face discussions with the customer, successfully gaining the trust of the customer's technical department.
Later, Director Ueda received positive feedback and praise from the customer.
We were grateful that the motor selection error was prevented early in the estimation stage. If the order had gone ahead as initially planned and the motor capacity shortage was discovered during the final test run, reordering the motor (lead time of several months) would have caused major issues in the construction schedule. Please convey our thanks to your technical team as well!
I got praised by the customer for being reliable! Our tech team isn't too shabby either! Thanks a bunch!
Well, this matter is now settled, but why does such a significant difference in the mixing power characteristics arise due to the "difference in flow"? In literature that describes the power characteristics of laminar and turbulent flows, you often see the following concise sentence.
What is Laminar Flow Region?
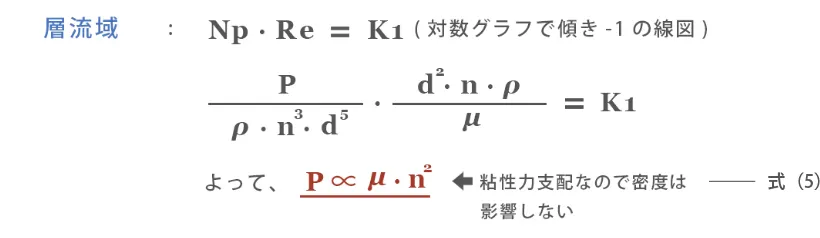
In the region where viscous forces dominate the flow behavior, as indicated by the liquid stopping immediately when the impeller stops, the power is proportional to the square of the rotational speed and the first power of viscosity, and it is not related to density.
What is Turbulent Flow Region?
Indicates the region governed by inertial forces (even if the impeller stops, the liquid does not stop immediately due to inertial forces). Under conditions with baffles (Np value is constant), the mixing power is proportional to the cube of the rotation speed and the first power of the density, and is not related to viscosity.
The above sentence is concise and clear for those who have actually collected power data using a test machine, calculated Np values and Reynolds numbers, and plotted them on a graph, as they can understand it through calculations and formulas. However, it might be a bit difficult for those who haven't had the opportunity to observe the flow state in the laminar region of a ribbon impeller to grasp the image. Therefore, let's first explain in an easy-to-understand manner how high-viscosity fluid in the laminar region moves within the tank with a ribbon impeller rotating in the upward direction.
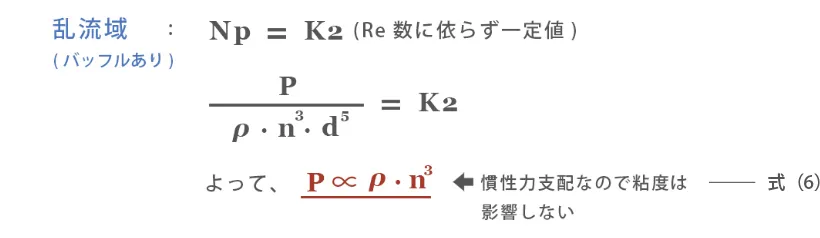
Figure 4 shows the shape of the double helical ribbon impeller and the flow pattern in the laminar region. Generally, the flow throughout the tank involves an upward flow generated by the lifting effect at the tank wall where the helical blades are rotating. This flow rises to the liquid surface and then becomes a downward flow near the agitator shaft, promoting overall vertical mixing, as indicated by the red line in the left illustration of Figure 4.
Figure 4. Ribbon Impeller Shape and Flow Pattern
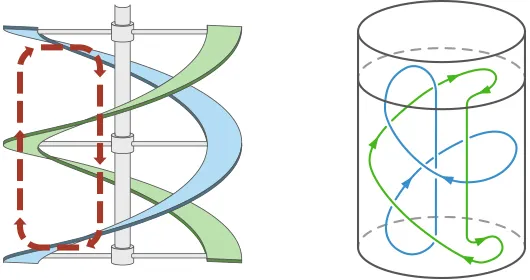
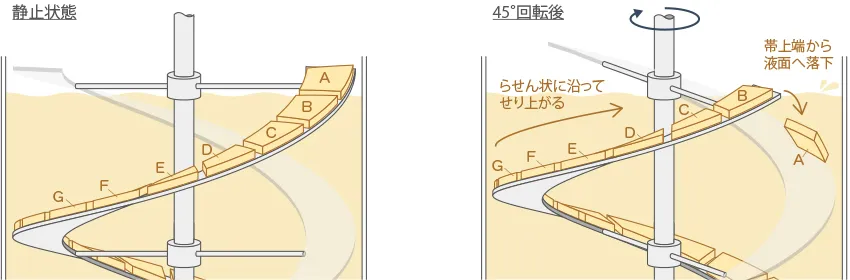
So why is upward movement created with the fluid near the spiral blade in the laminar flow region? Figure 5 models the behavior of a high-viscosity liquid lump on the upper surface of the helical ribbon blade near the liquid surface when the stationary ribbon impeller is rotated by 45 degrees.
Figure 5. Modeling the Behavior of a High-Viscosity Liquid Lump on a Ribbon Blade
The high-viscosity liquid lump on the upper surface of the helical blades is prevented from moving laterally by the presence of an extensive stationary liquid lump near the shaft, which is an area where the dragging effect of the helical blades does not reach, and by the tank wall. Additionally, it is physically blocked from moving downward by the helical blade itself. Therefore, it can only move upward along the upper surface of the blades as the ribbon blade rotates in the lifting direction. To put it more simply, in the laminar region, the high-viscosity liquid lump moves like people running up an emergency spiral staircase in a building. When lifting the high-viscosity fluid lump on the upper surface of the helical blades, the rotating ribbon impeller bears a significant load, which is not present in the transitional or turbulent flow regions. However, as the flow transitions from the laminar to the turbulent region, the presence of this climbing high-viscosity liquid lump disappears, and the flow changes to a gentle, circumferential flow with a vortex near the shaft, similar to when cream is mixed into coffee.
Point 2: The Stirring Load on the Ribbon Blade Differs Greatly Between the Turbulent and Laminar Regions
Here, let's explain the stirring load when the high-viscosity liquid lump climbs up the upper surface of the helical blades using a familiar example of a coffee cup. By understanding this through a common everyday experience, I hope you can grasp the image of the stirring load on the ribbon blade in the laminar region.
1. Stirring Coffee with a Spoon
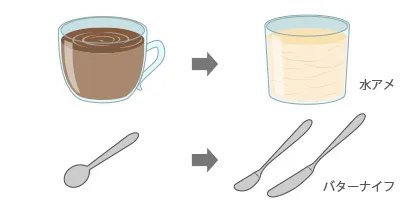
First, imagine pouring milk into coffee and stirring it with a spoon. By rotating the spoon, the coffee and milk mix easily and uniformly. Then, after mixing, slowly lift the spoon out of the coffee. You will notice that some drops fall, but the surface of the liquid remains flat. Additionally, the pulling force (F0) required to lift the spoon is very minimal.
2. Switching to Syrup and a Butter Knife
So, what would happen if you performed the same action with a high-viscosity fluid (in the laminar flow region)? Let's replace coffee with syrup. The syrup is as thick as winter honey. It's like trying to scoop it up with chopsticks, but the chopsticks break instead (around 500,000 mPa·s). To better illustrate the movement phenomenon on a flat surface, let's replace the spoon with a flat butter knife.
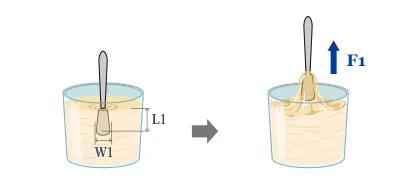
3. Syrup and a Short Butter Knife (Vertical Movement)
Next, picture inserting a short butter knife vertically into the syrup and slowly lifting it up. You can imagine the syrup clinging to both sides of the knife, being dragged upward as the knife rises. In this case, the force required to lift the knife (F1) is significantly greater than the force needed for low-viscosity liquids like water or coffee (F0).
4. Syrup and a Long Butter Knife (vertical movement)
Next, let's think about the pulling force. The width of the butter knife is the same, but the length of the knife part is doubled. Insert this longer butter knife vertically into the syrup and slowly lift it up. Do you think the force needed to lift it (F2) will be the same as the force for the shorter knife (F1)? Probably, you'll need about twice the force. Also, the amount of syrup clinging to the knife and moving up will likely be about twice as much. What we can understand here is that both the force needed to lift the knife and the amount of syrup rising with the knife increase proportionally with the length of the knife.
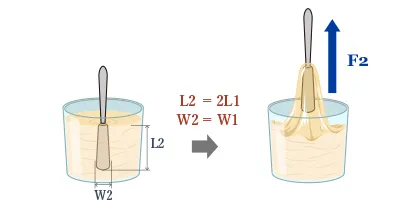
5. Syrup and a Short & Long Butter Knife (diagonal movement)
Finally, imagine inserting both the short and long butter knives diagonally into the syrup and pulling them out at an angle. Just like before, the syrup clings to the knife and moves with it. The change in the pulling force due to the knife's length is similar to the vertical case.
The phenomena we want you to imagine with these illustrations are the following two points.
1. In low-viscosity (turbulent) conditions, there is minimal fluid movement and pulling force generated by a flat plate moving in the plane direction. Additionally, the fluid movement and pulling force are not significantly affected by the length of the plate.
2. In high-viscosity (laminar) conditions, the fluid adheres to both sides of the flat plate and moves significantly along with the plate's movement in the plane direction, resulting in a larger pulling force. The fluid movement and pulling force are almost proportional to the length of the plate.
The above explanation is about a butter knife moving through stationary syrup. In terms of action and reaction, it represents the load on a ribbon blade when a high-viscosity liquid climbs up the spiral surface under high-viscosity (laminar) conditions. In other words, under high-viscosity (laminar) conditions, the width and length of the spiral blade correspond to the width and length of the butter knife.
The power estimation formula (7) for a ribbon impeller in the laminar flow region, as published in the literature, includes the total length of the spiral blade (L) as a significant factor. This is because the power of the rotating ribbon impeller (the load on the blade) is due to the load of dragging the high-viscosity liquid along the entire length of the spiral blade. Additionally, in the laminar flow region, flow interference is almost zero, so if the number of blades (np in the formula) doubles, the power also doubles.
<References>Koji TAKAHASHI, Kunio ARAI and Shozaburo SAITO: J. chem. eng. Jpn., vol.13, no.2, 147 (1980)
In equation (7), L represents the total length of the spiral blade of the ribbon impeller, and np indicates the number of spiral blades. Here, we will omit the detailed explanation of each factor in the formula. However, if you can visualize that the dragging effect along the total length of the spiral blade is the main factor for the stirring power of the ribbon impeller in high-viscosity (laminar) conditions, it will be easy to understand why the length of the spiral blade (L) submerged in the liquid is included in the power estimation formula for laminar flow. Conversely, this power estimation formula for laminar flow becomes inapplicable as soon as the flow transitions to the transitional or turbulent region, due to the rapid decrease in the dragging effect. Therefore, it is crucial to be aware of changes in the flow. This awareness is indeed the mission of an engineer who predicts the overall framework.
As a side note, in a large mixing tank with a ribbon impeller, significant stirring torque is required to create sufficient vertical circulation flow throughout the high-viscosity liquid in the tank, necessitating a low-speed, high-torque agitator driving unit. You should also be aware that the spiral blades, horizontal support arms, and agitator shaft of the ribbon impeller, which effectively create vertical circulation by rotating upward, are subjected to significant downward thrust loads due to this flow pattern. Let's aim to be the kind of engineers who can look at an agitator drive unit and say, "Oh, this one's definitely a high-torque spec for high-viscosity stuff!" just by checking out the motor, reducer, shaft diameter, and bearings.